Clarity
Clarity empowers restaurant owners and managers with financial clarity and control over their business operations.
Role
Senior Product Designer
Team
PM, IC, Dev
Platforms
Web & Mobile
Timeline
5 weeks
The problem
Raw data tables lacking insights
Information scattered across system
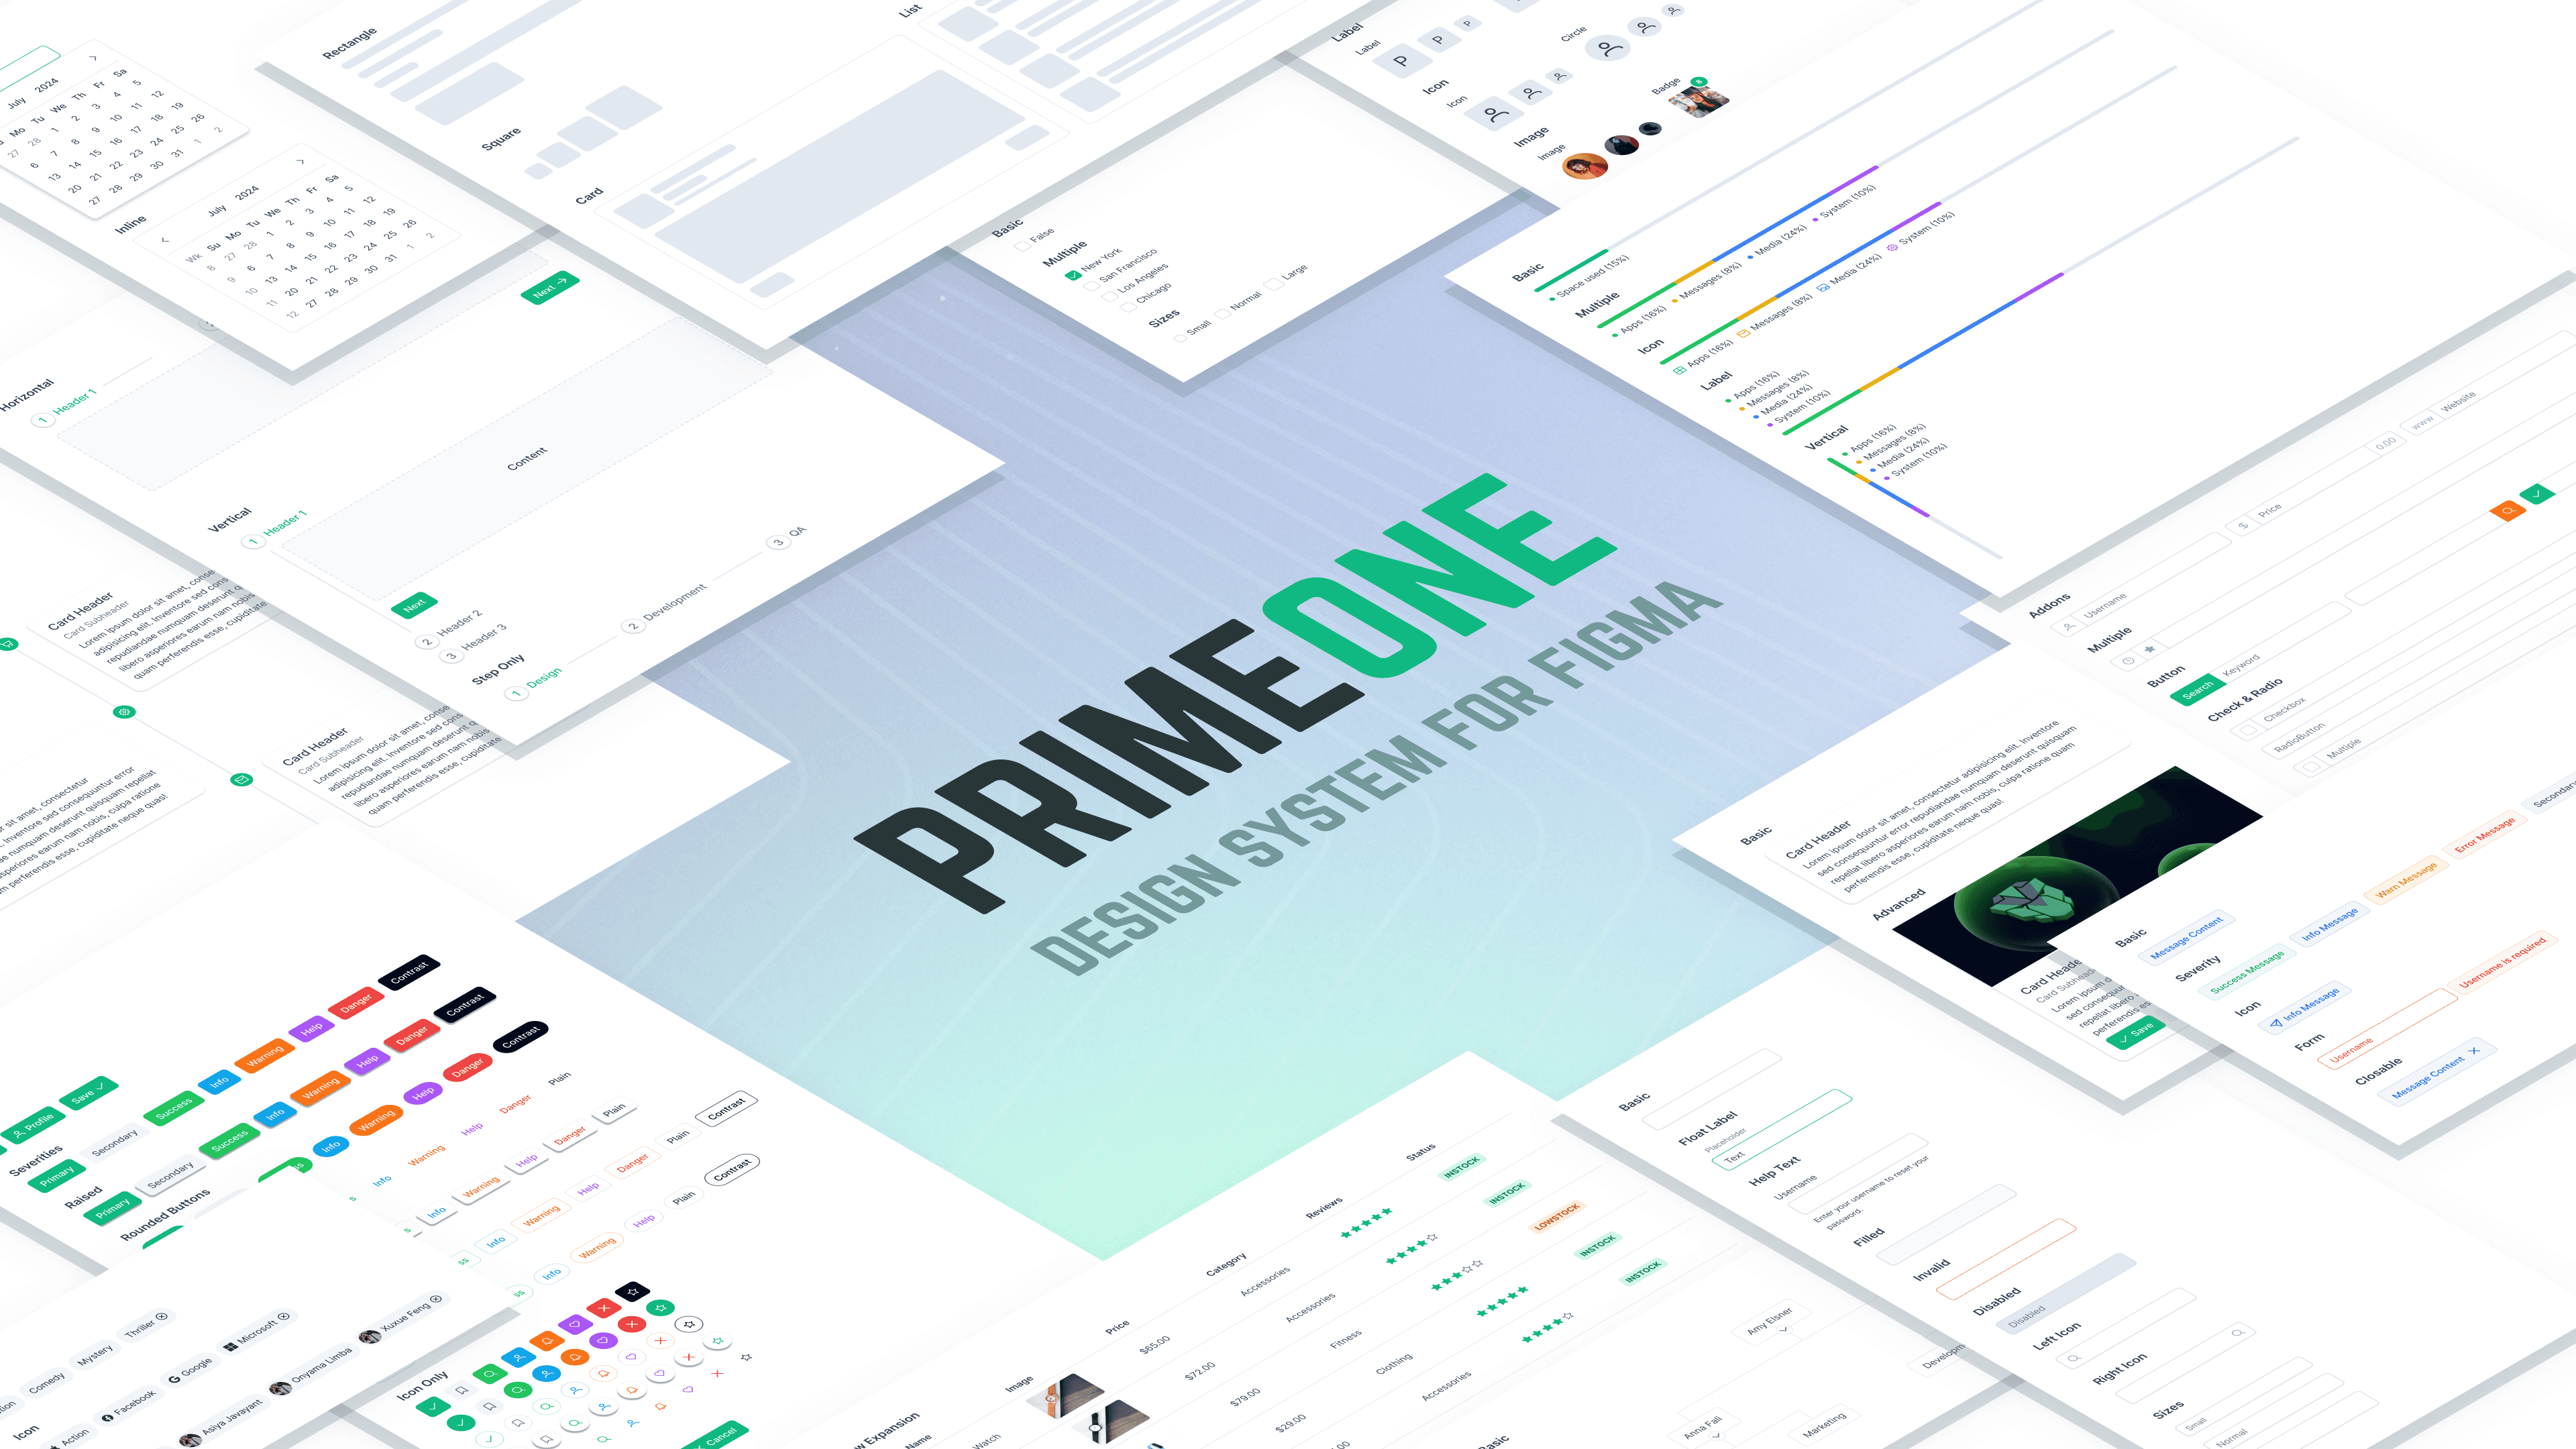
No design system = slow time to value
Business Impact
High support team workload (custom report requests)
Users frustrated, can't self-serve
No consistent design and lack of agility
The old version
Desktop
Mobile
Goal
Self-service dashboard with actionable insights for mobile and web
Unified, intuitive interface for purchase management
Scalable design system for speed
RESEARCH
Understanding Our Users
Conducted interviews with restaurant owners and managers
Some Clarity team members are active restaurant owners and former managers, giving us direct insight into real user needs.
User recordings (Smart Look) revealed what worked and what was confusing.r
Finding 1: Role-Specific Needs
Restaurant Owners
Restaurant Managers
Purchase Managers - Day to day operations (pricing, delivery)
Finding 2: Cognitive load and appeal
Big picture first, details on demand
Visual charts, trends, and comparisons, not raw numbers
Jobs to be done
Quickly see where money goes and spot issues.
Focus negotiation on top suppliers/products when costs change.
Instantly track compliance with approved products.
Testing solution direction using Wireframes
Solution
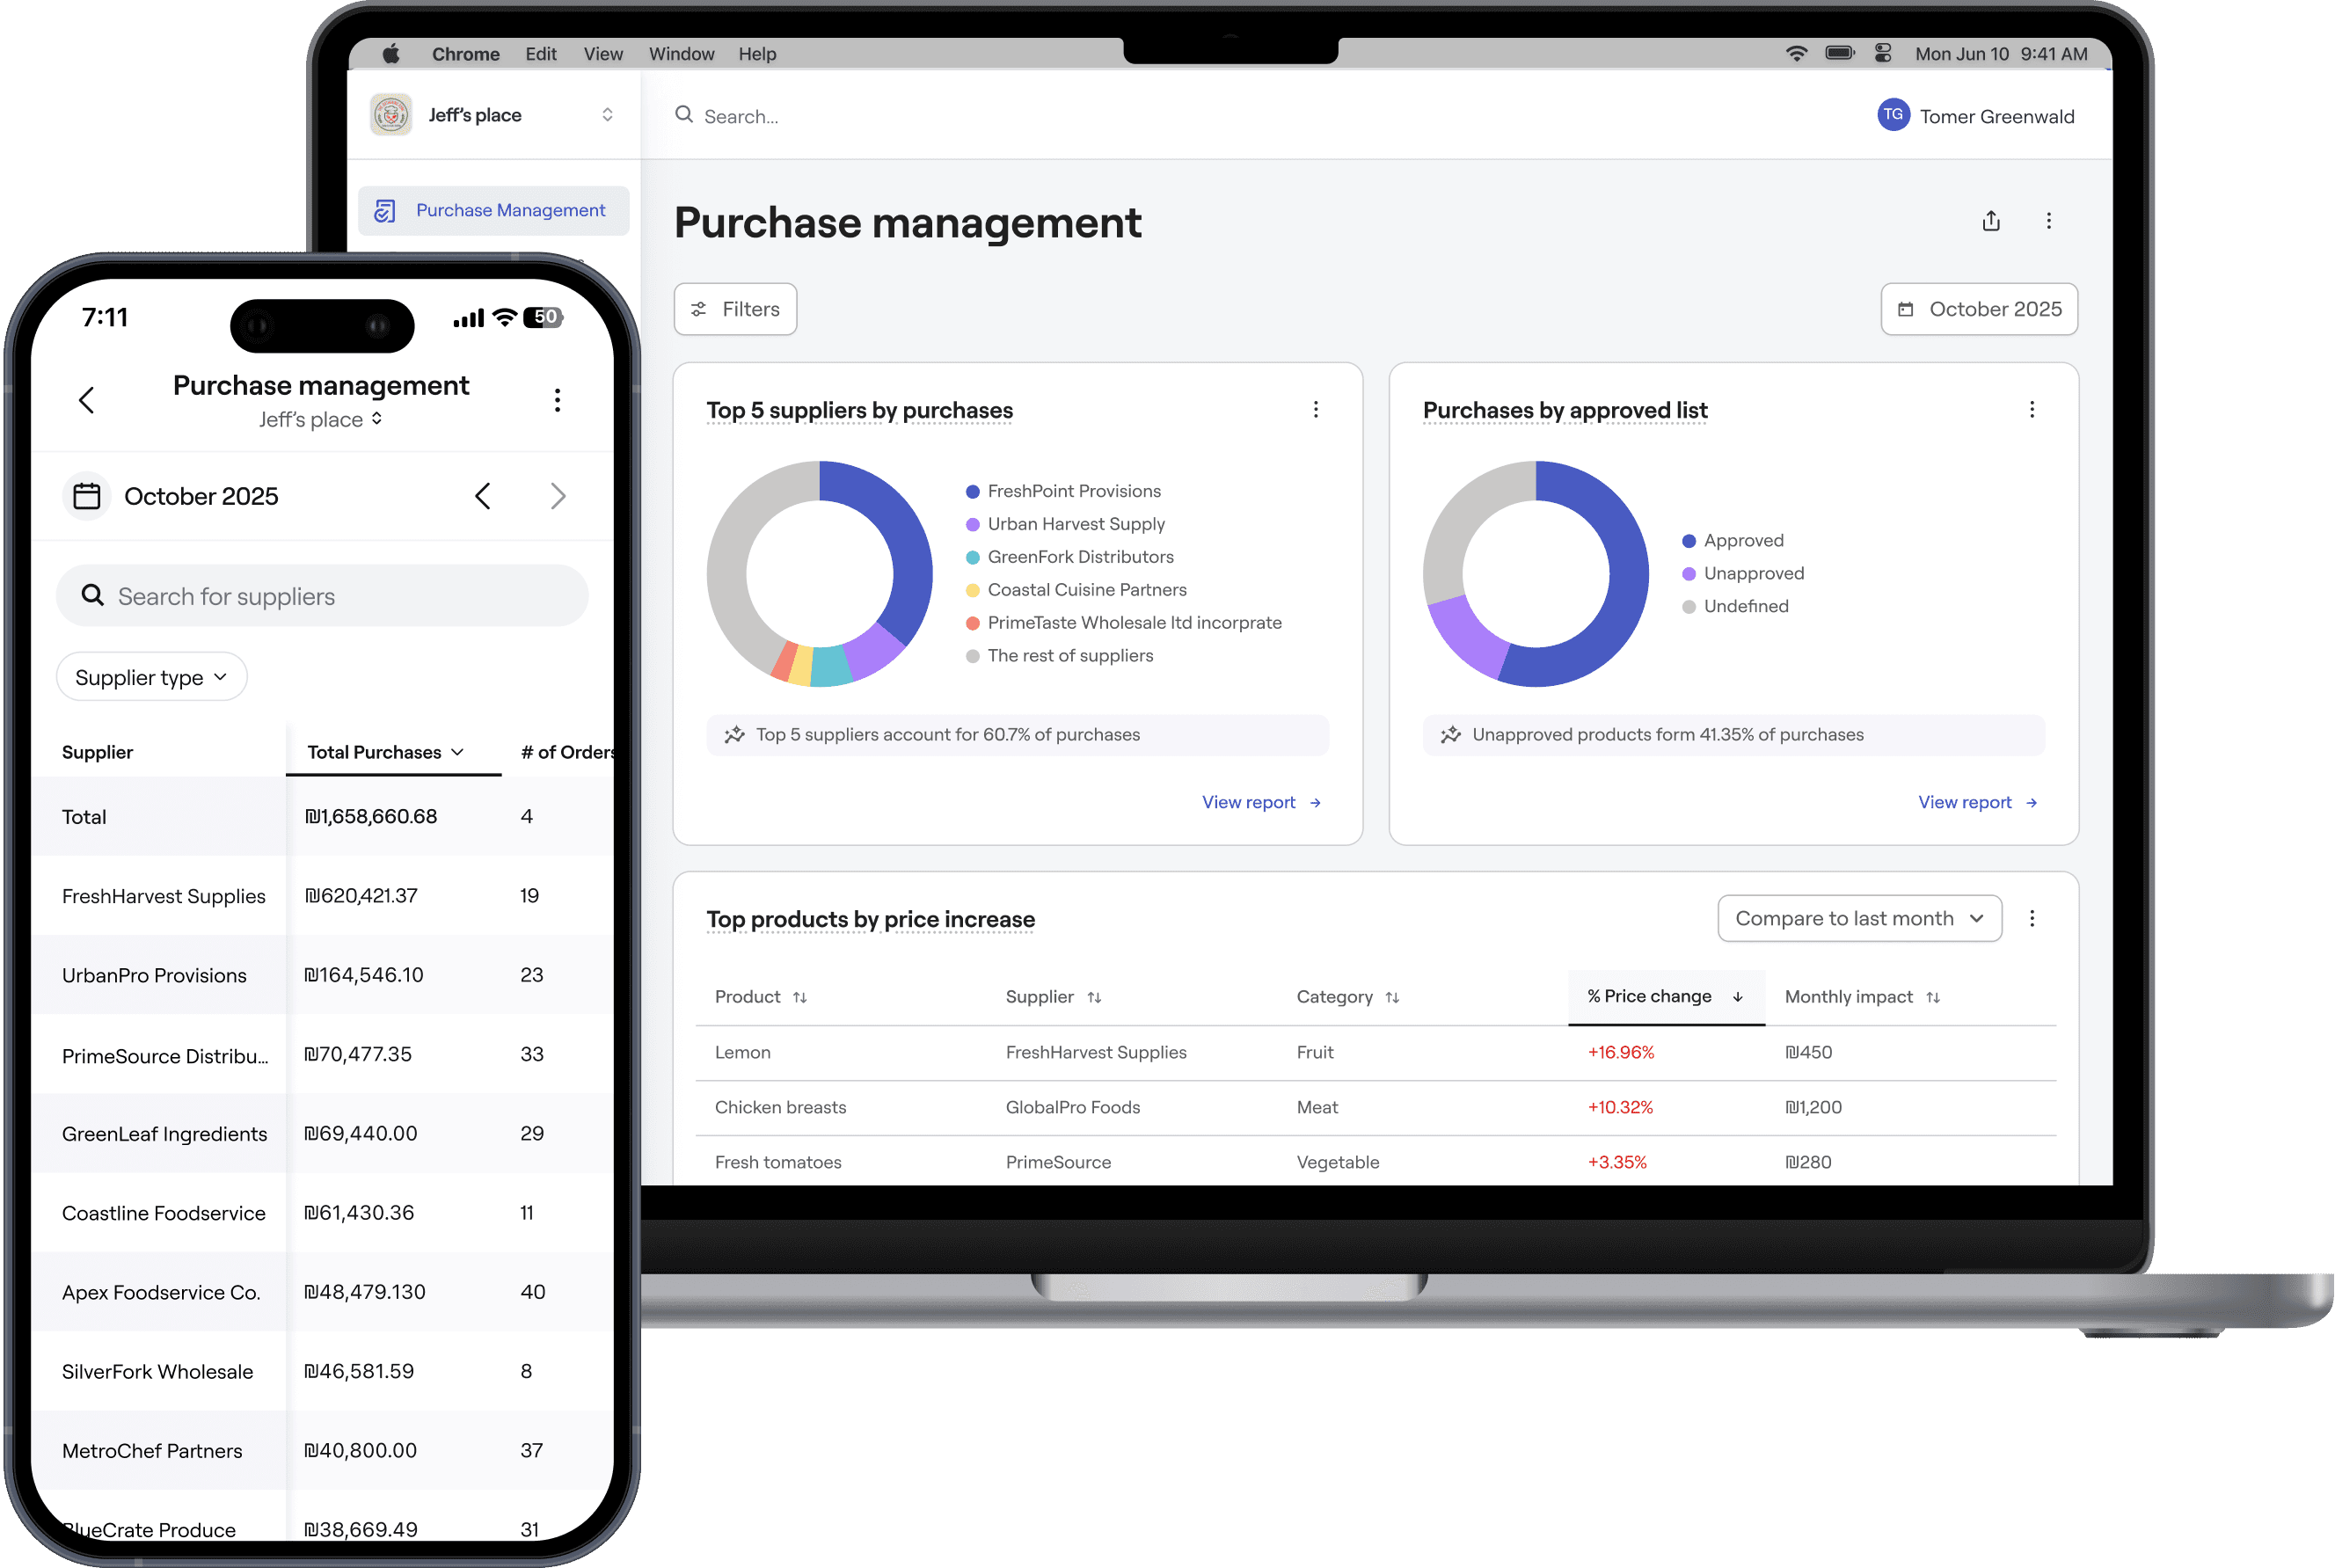
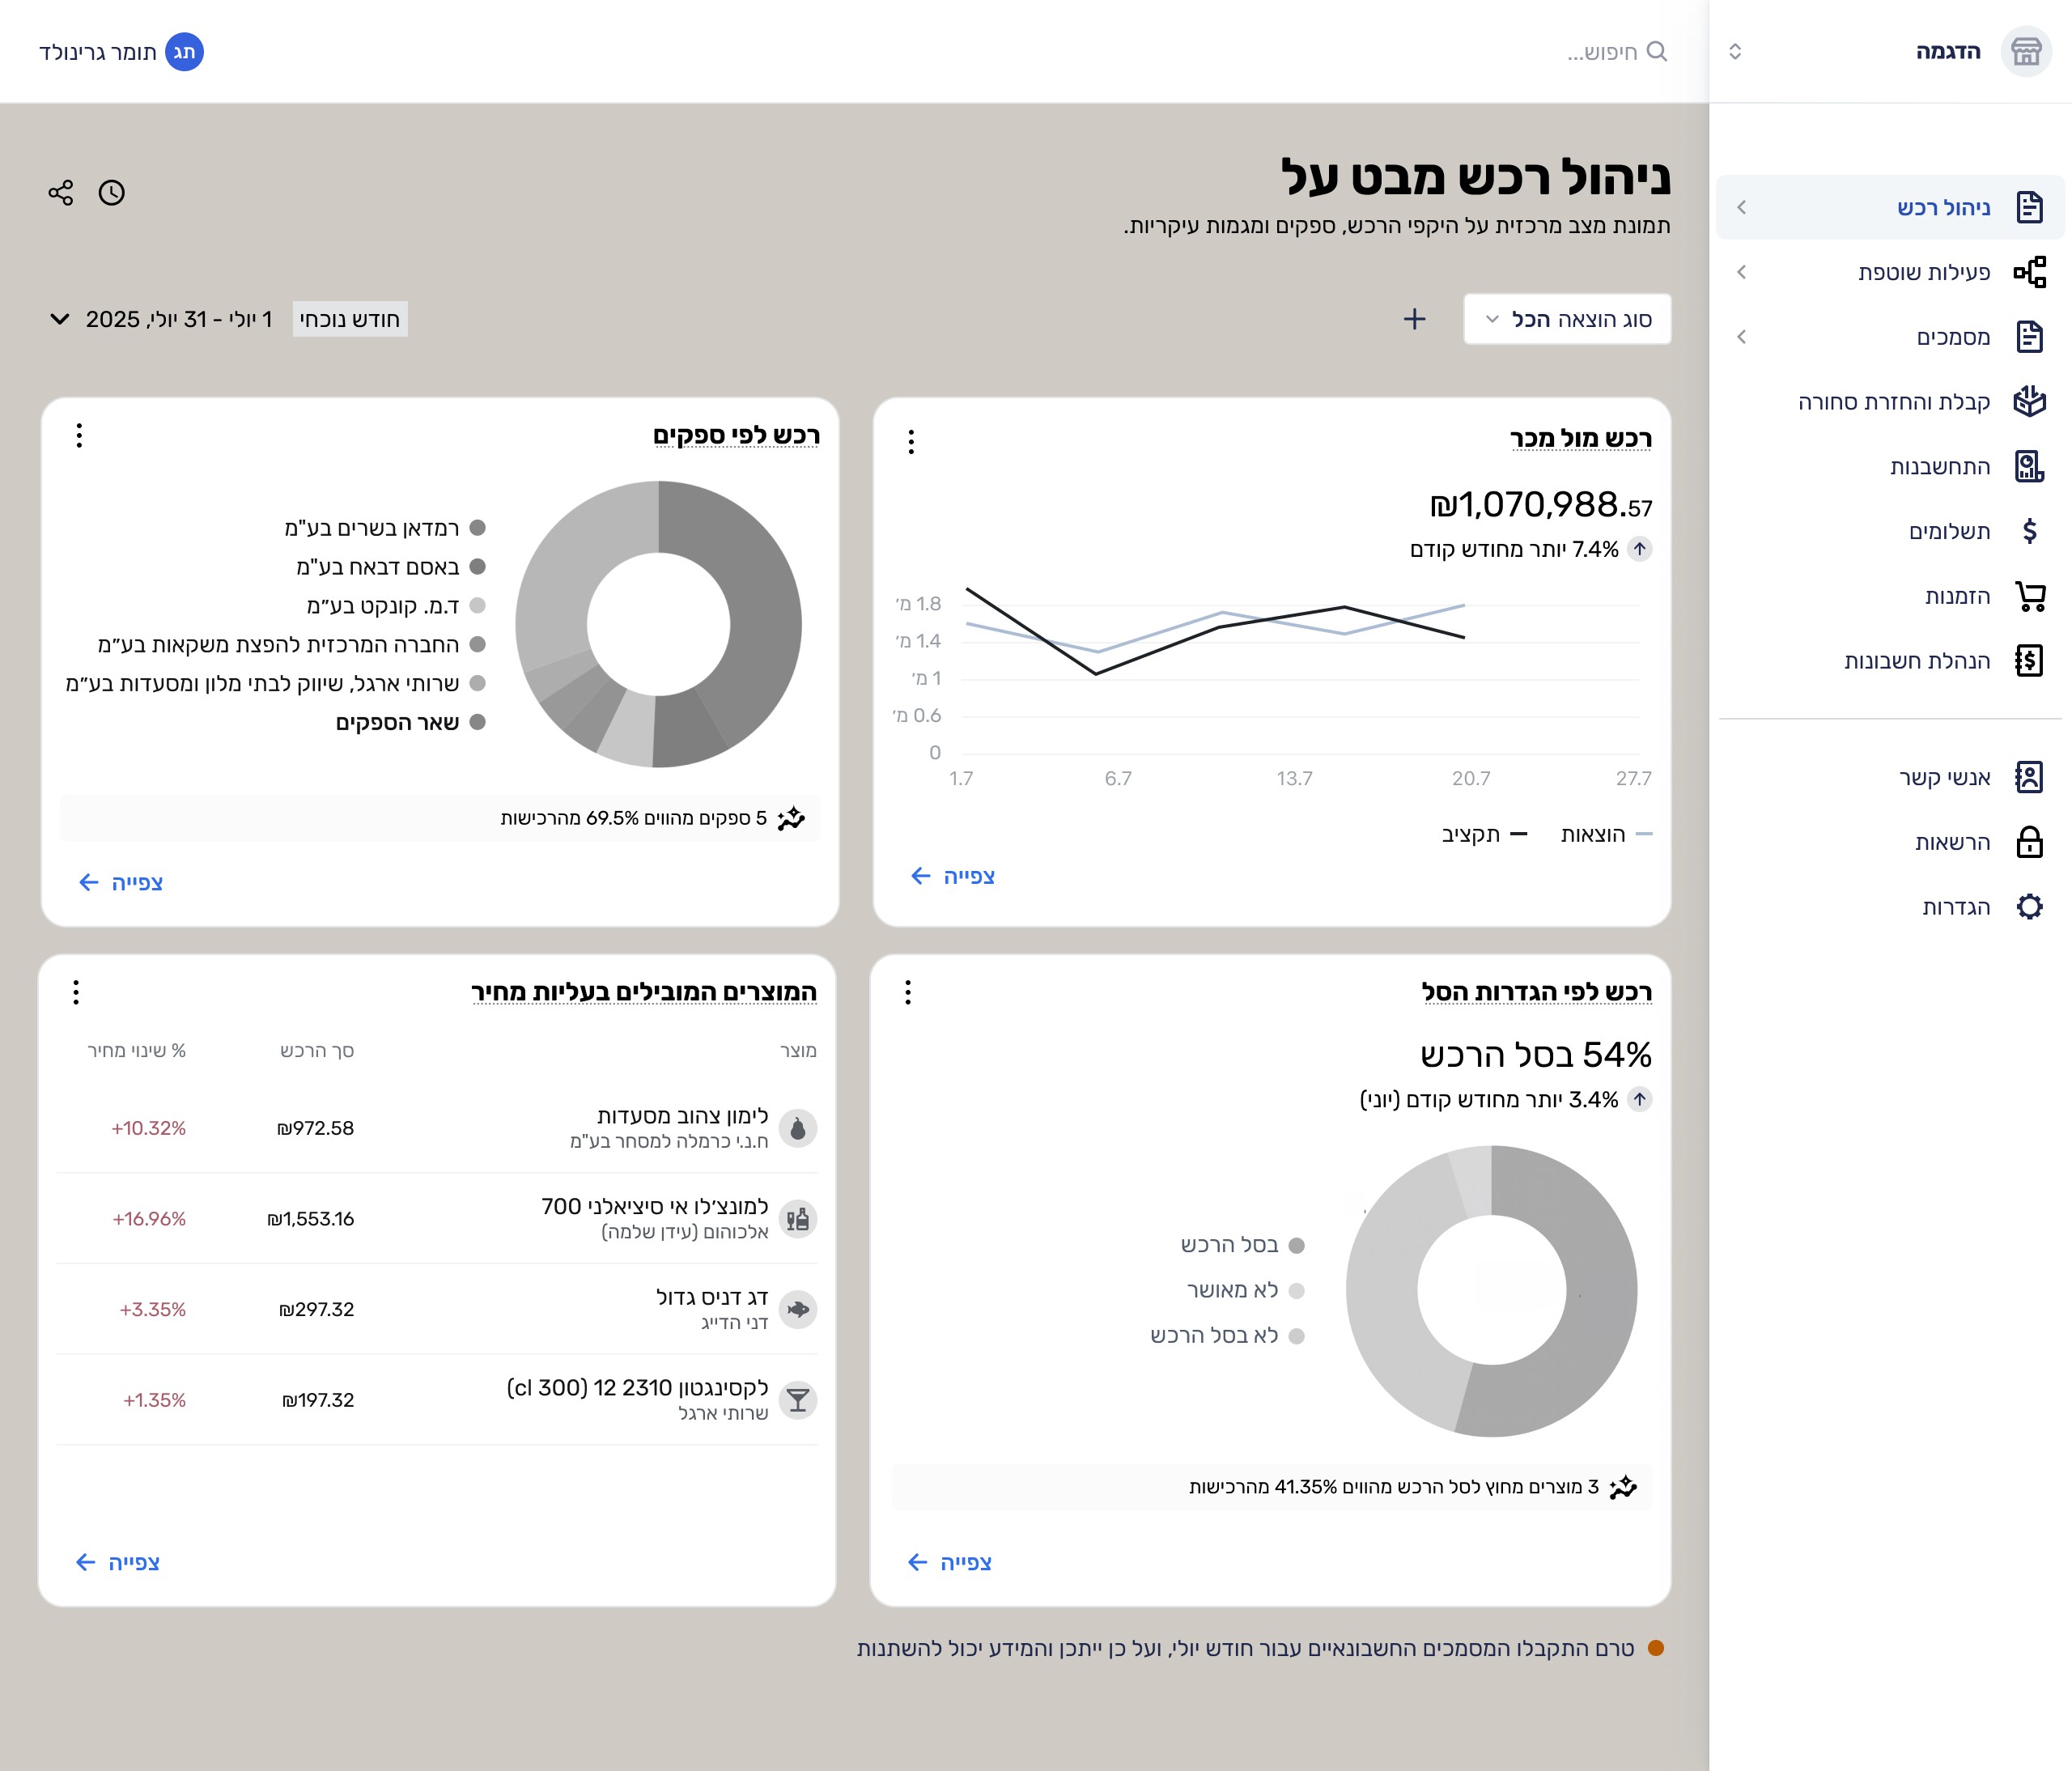
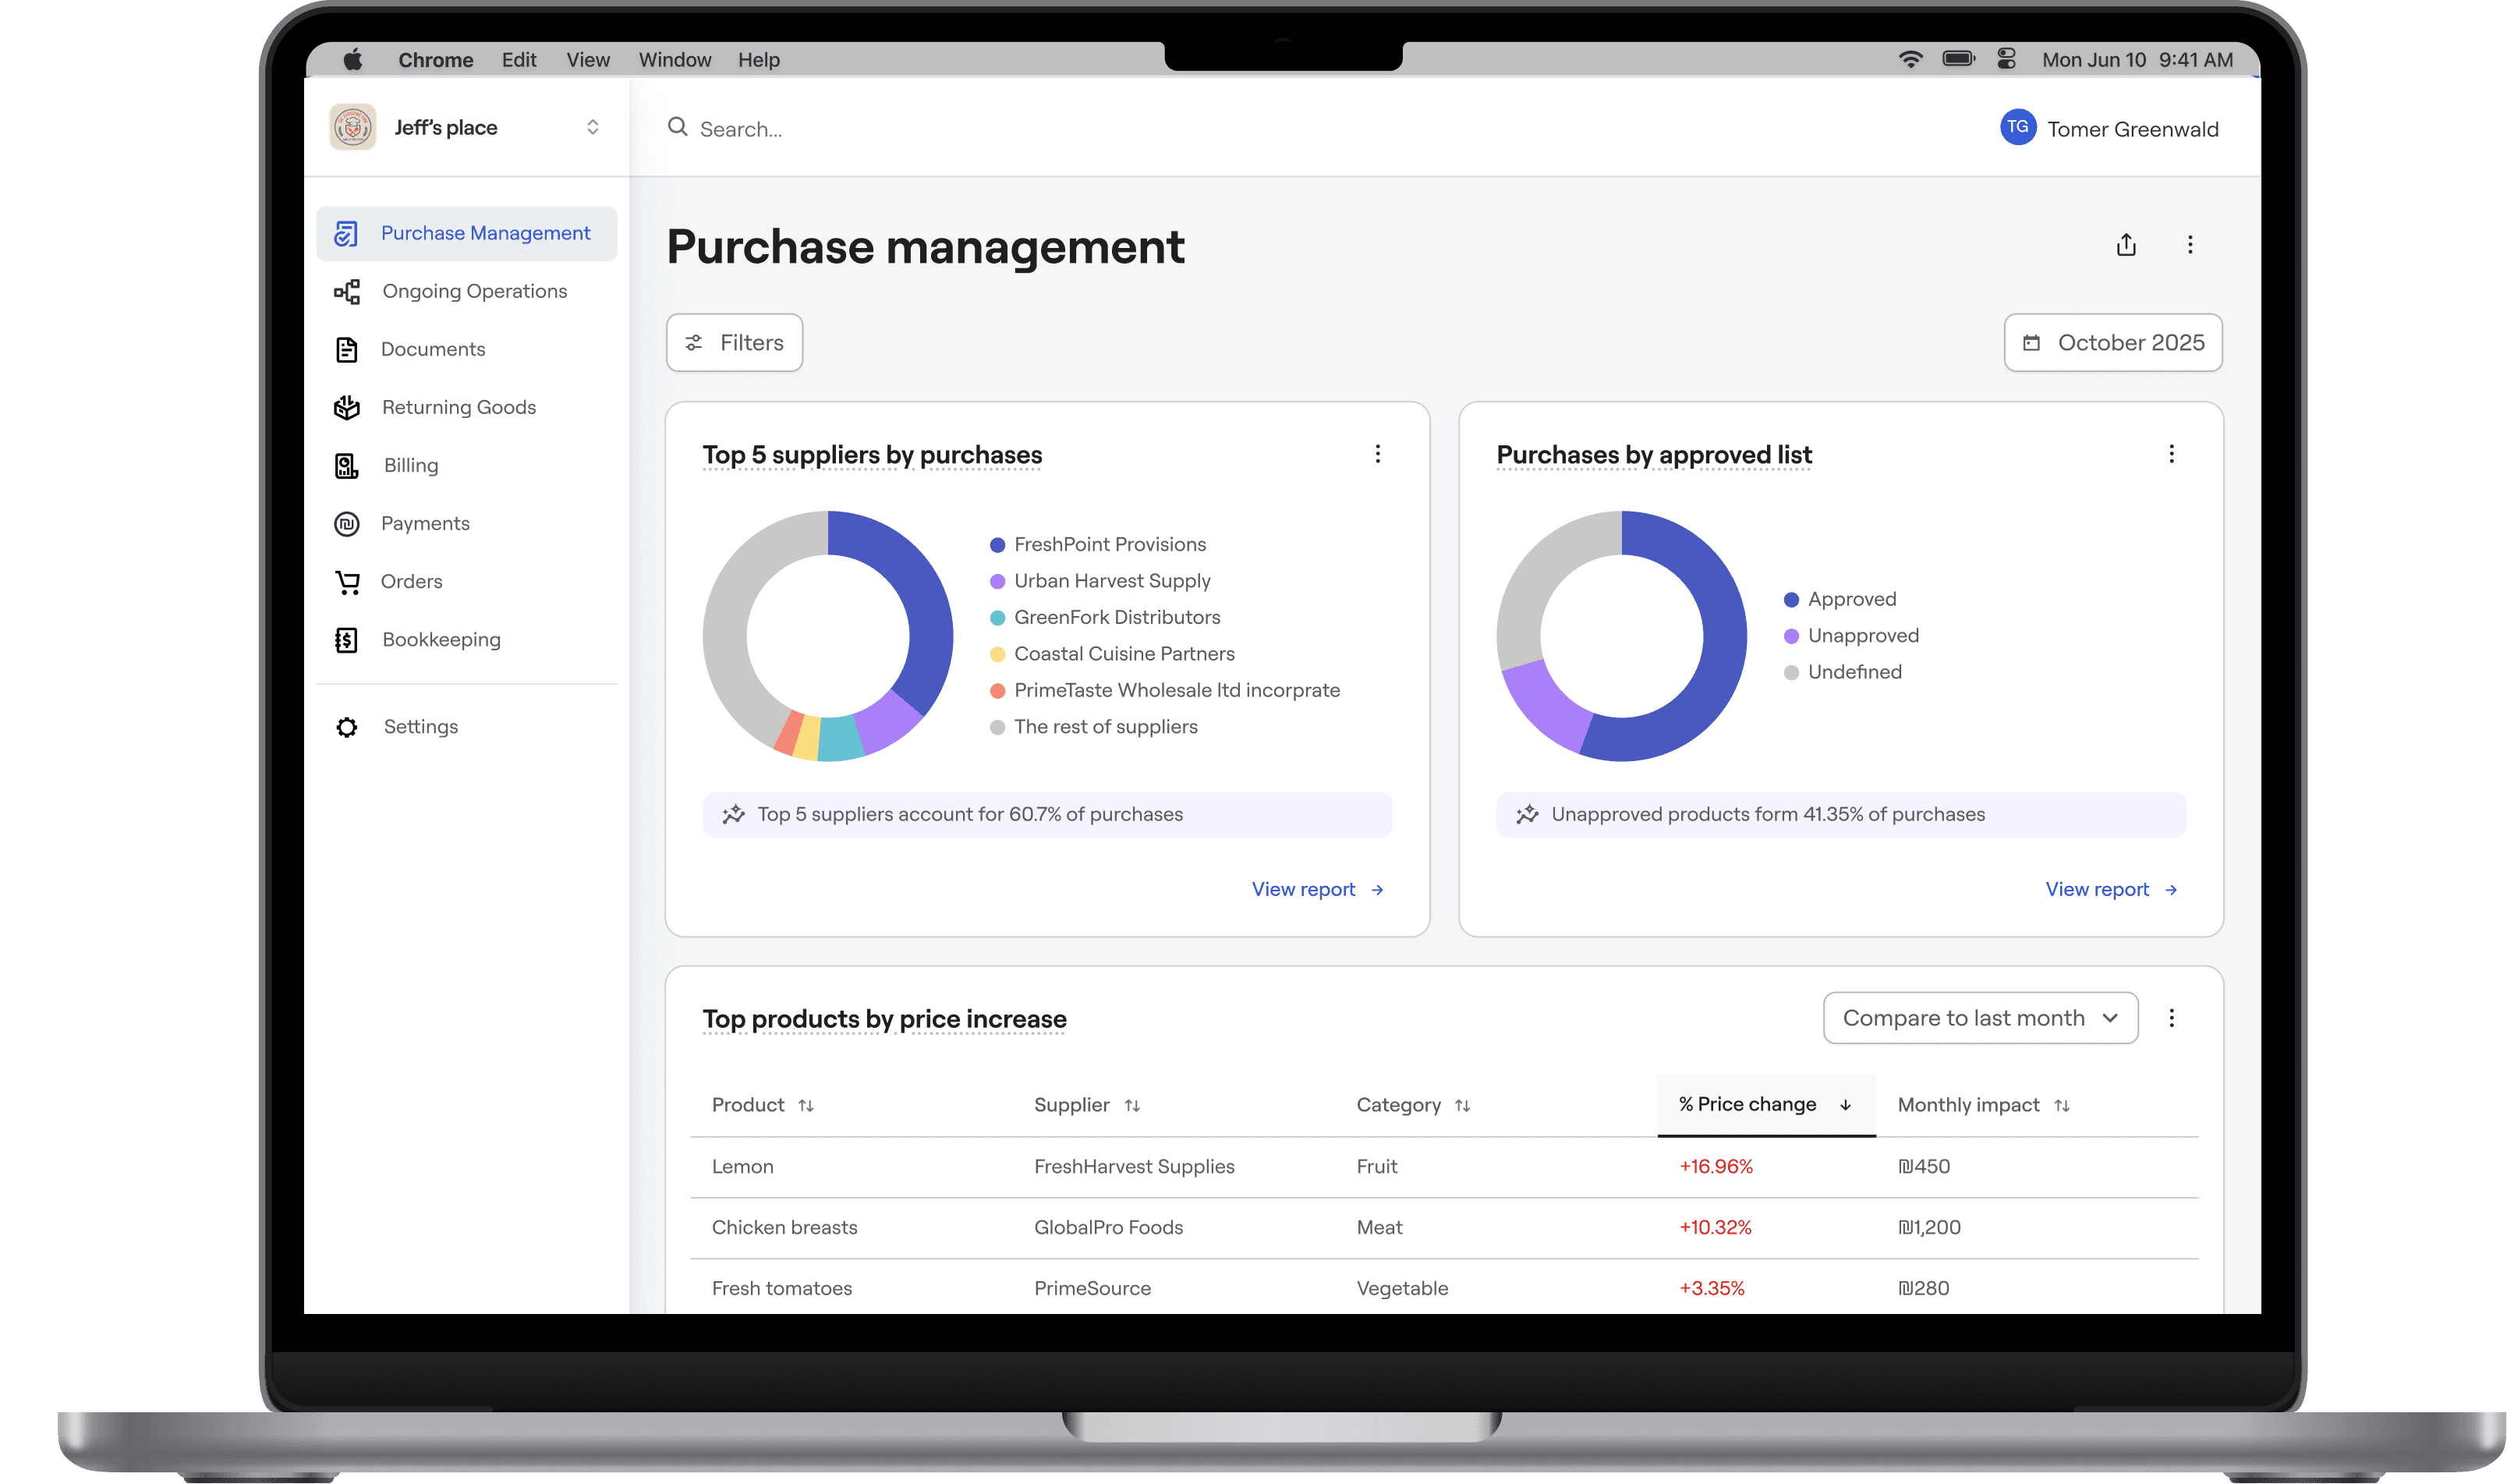
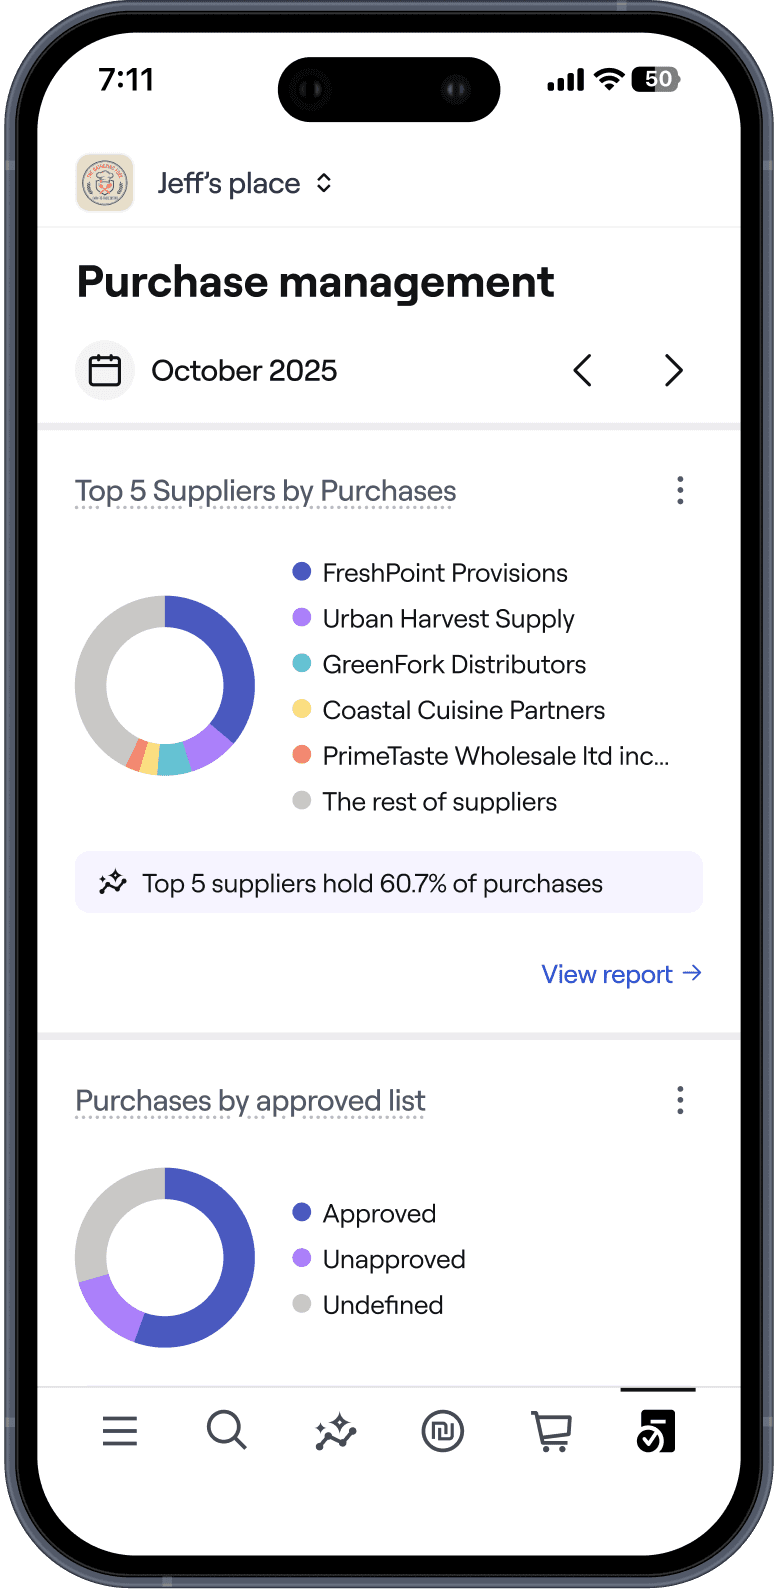
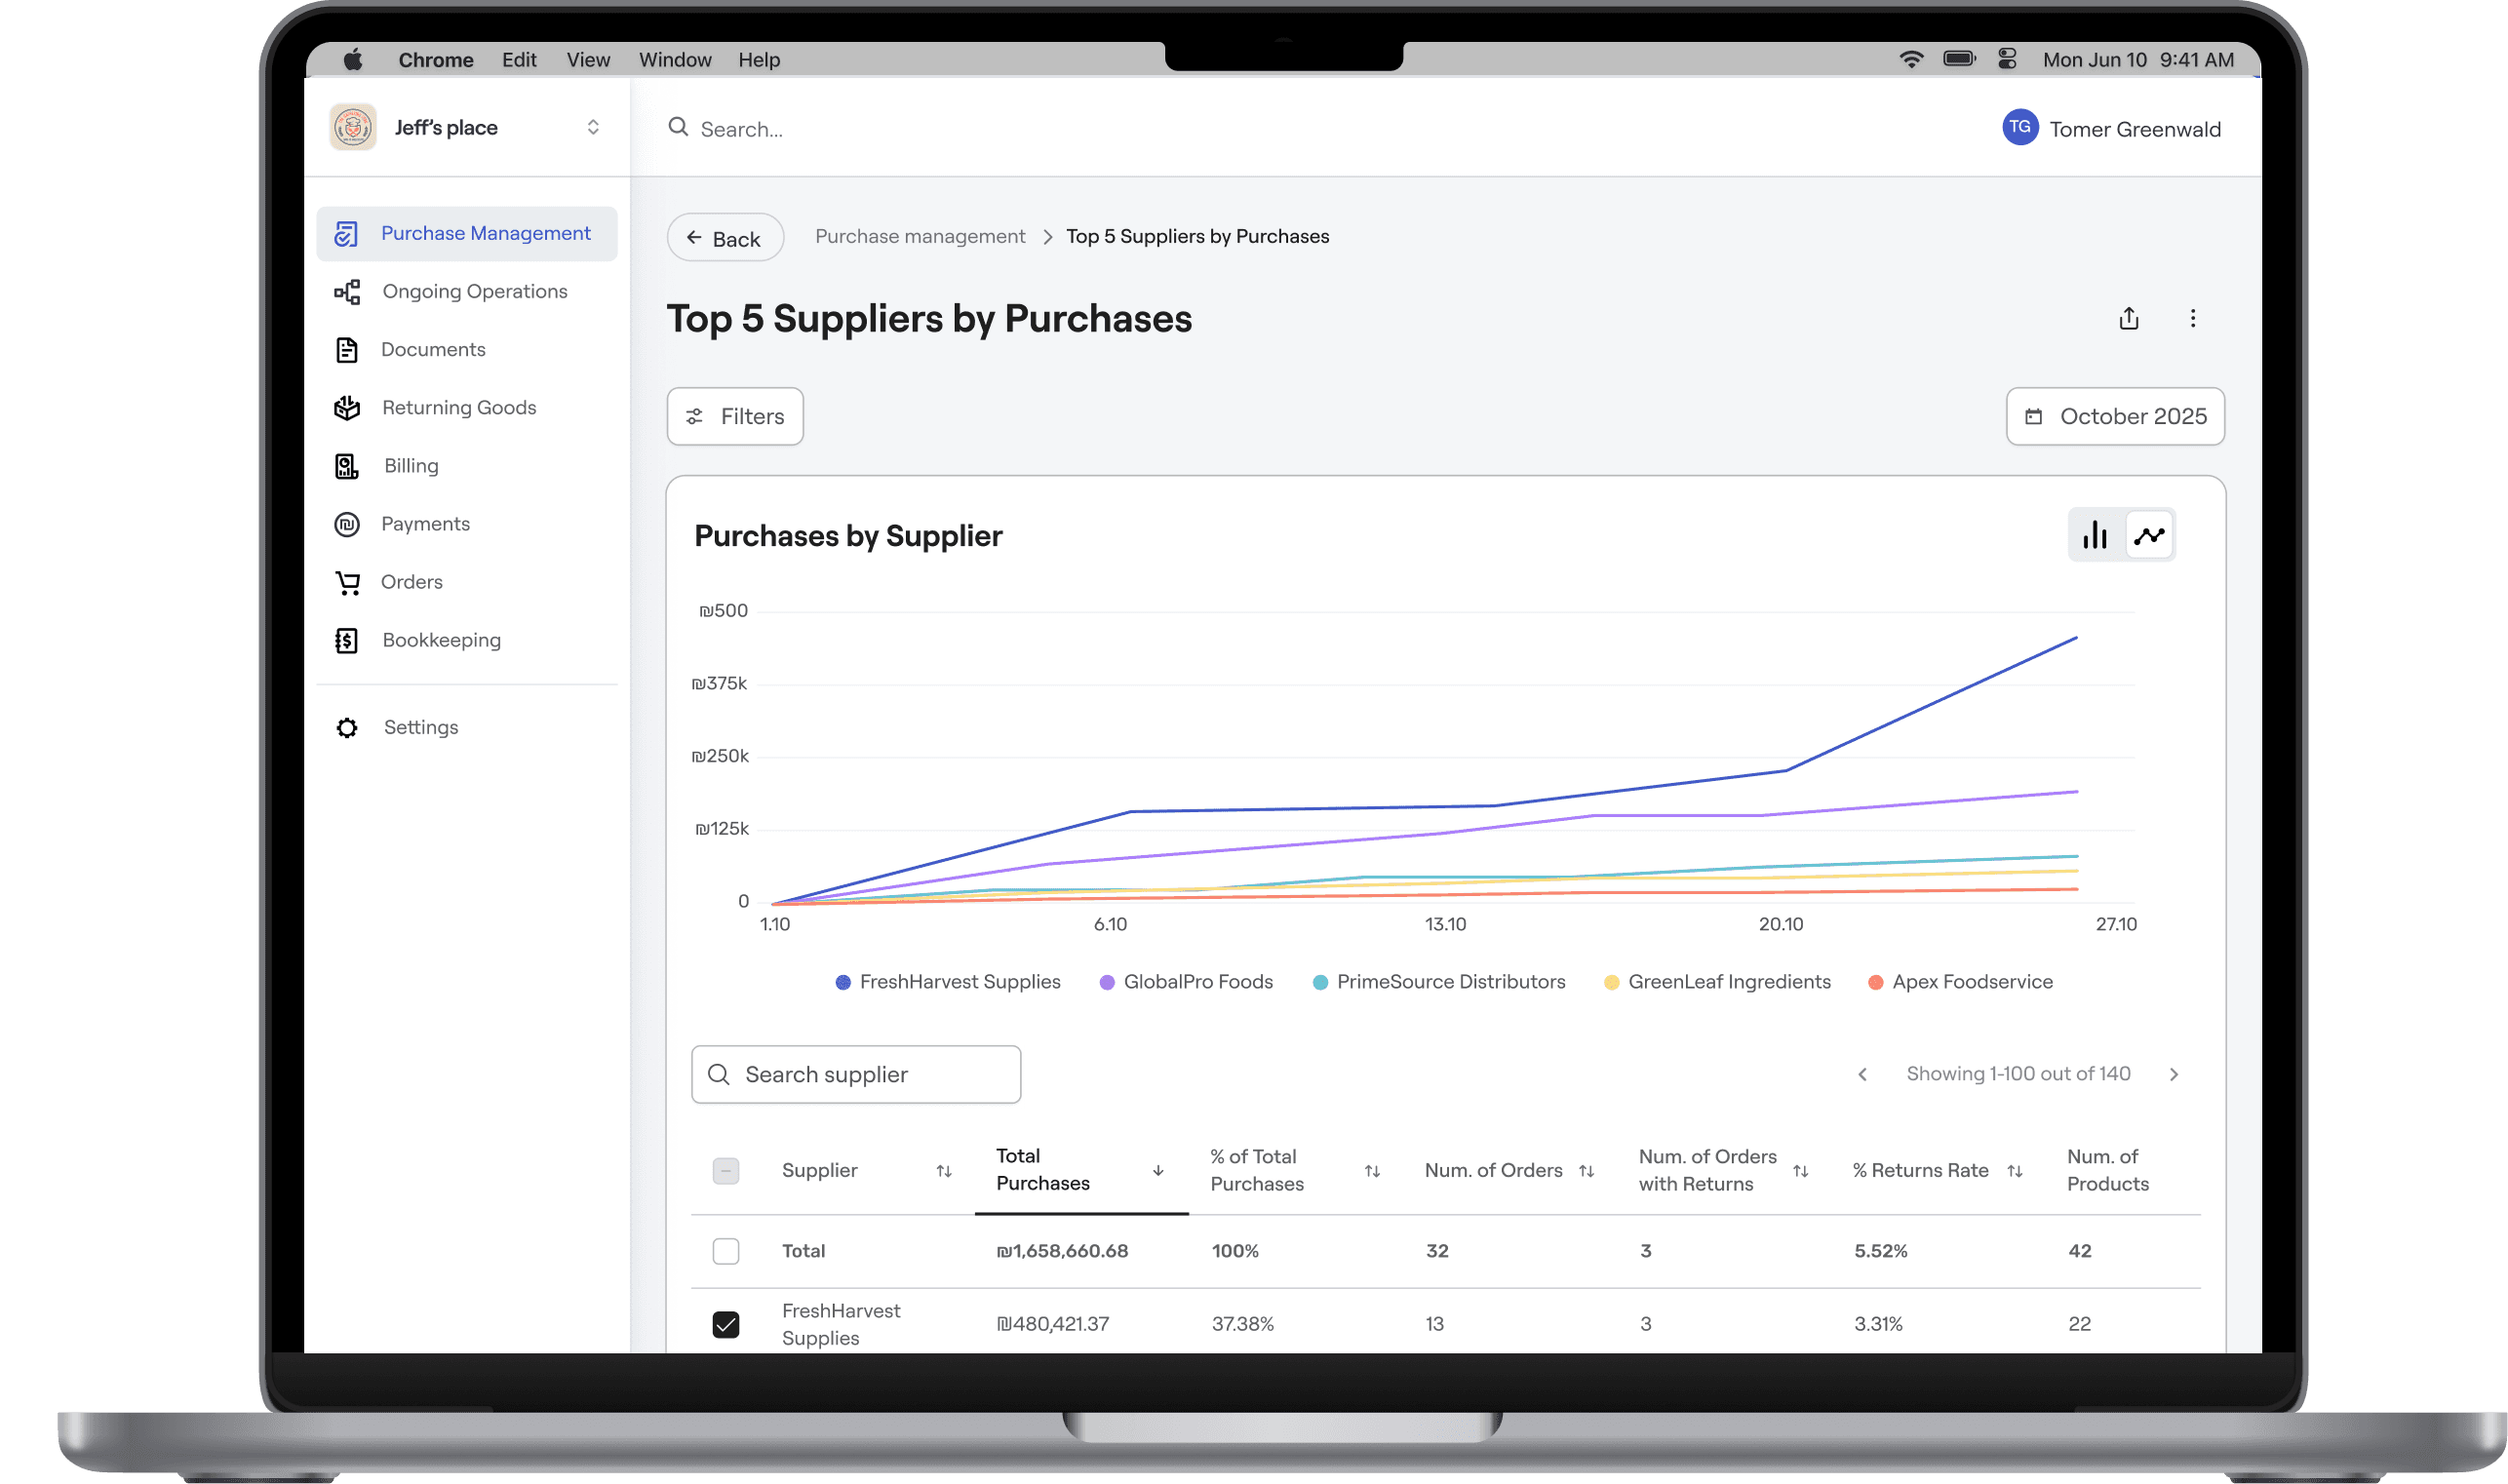
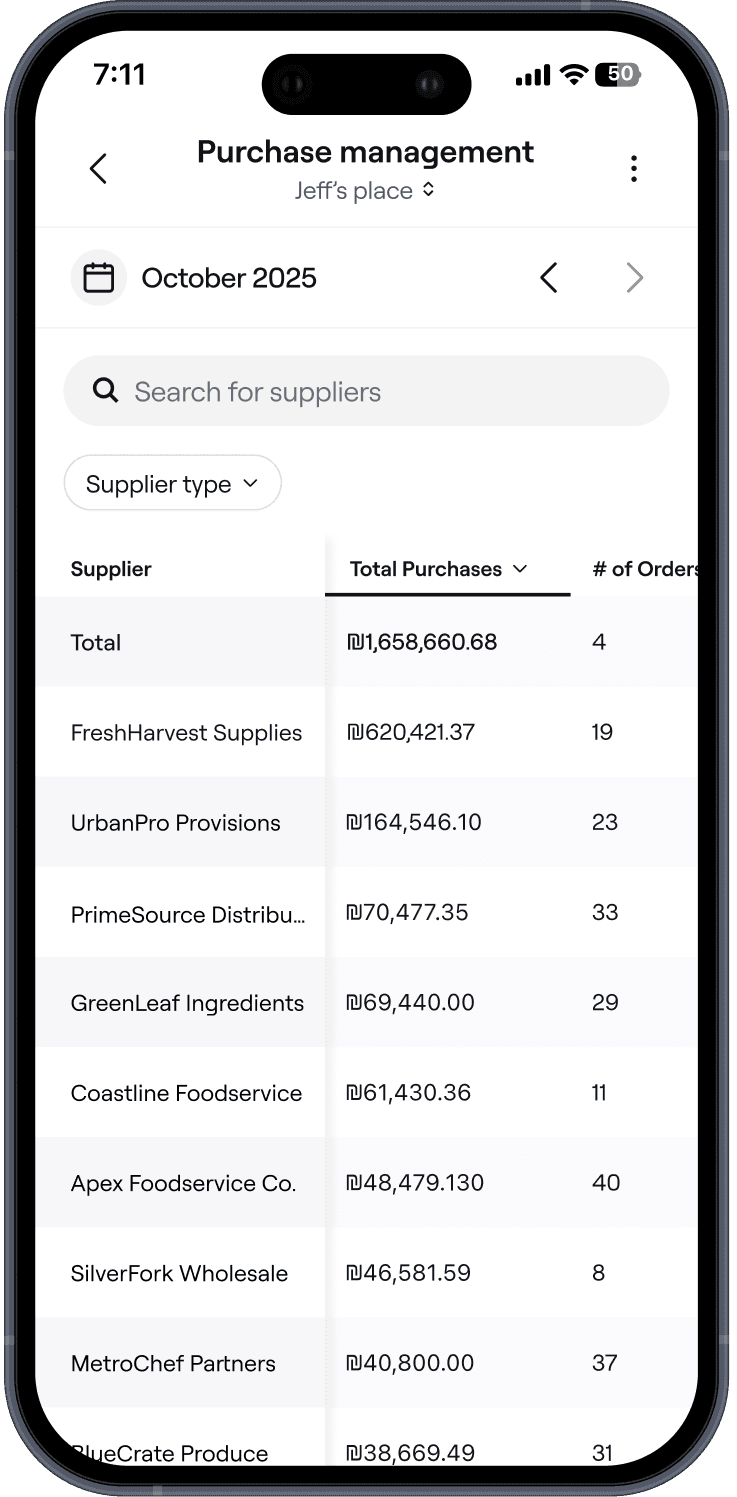
Centralized dashboard, overview at a glance
Desktop version optimized for focused deep work, and a mobile version designed to keep you informed while on the move.
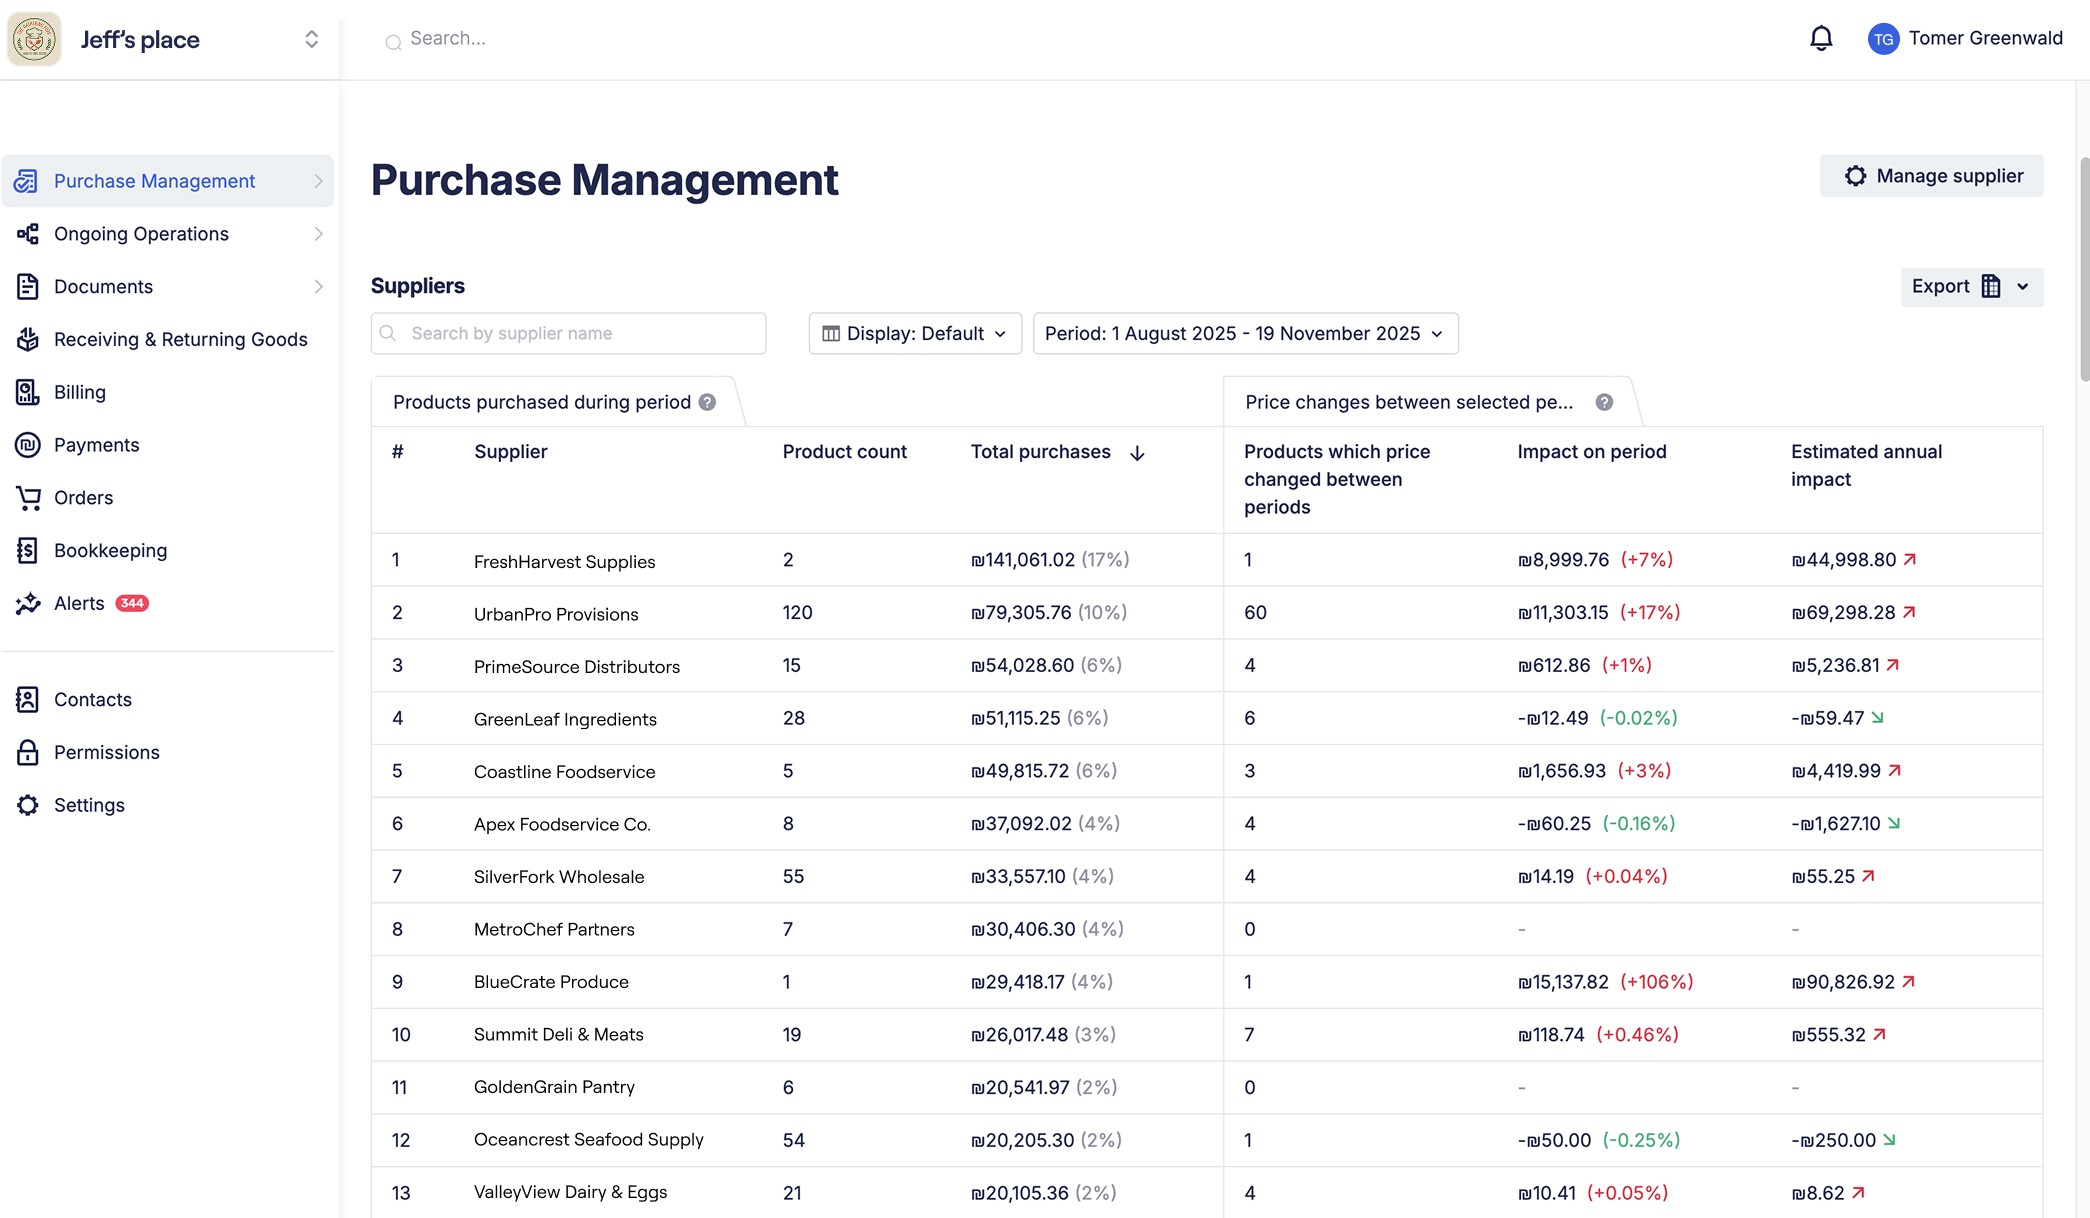
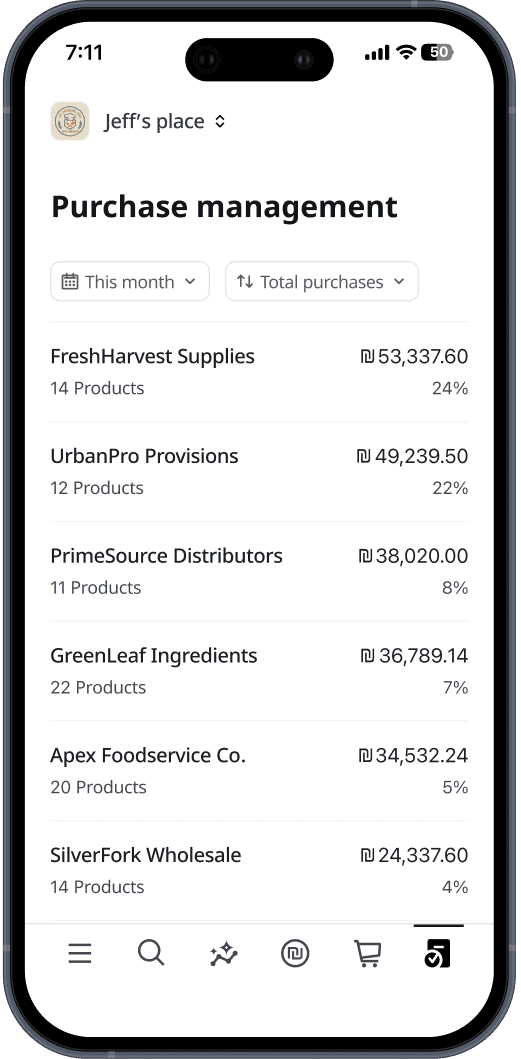
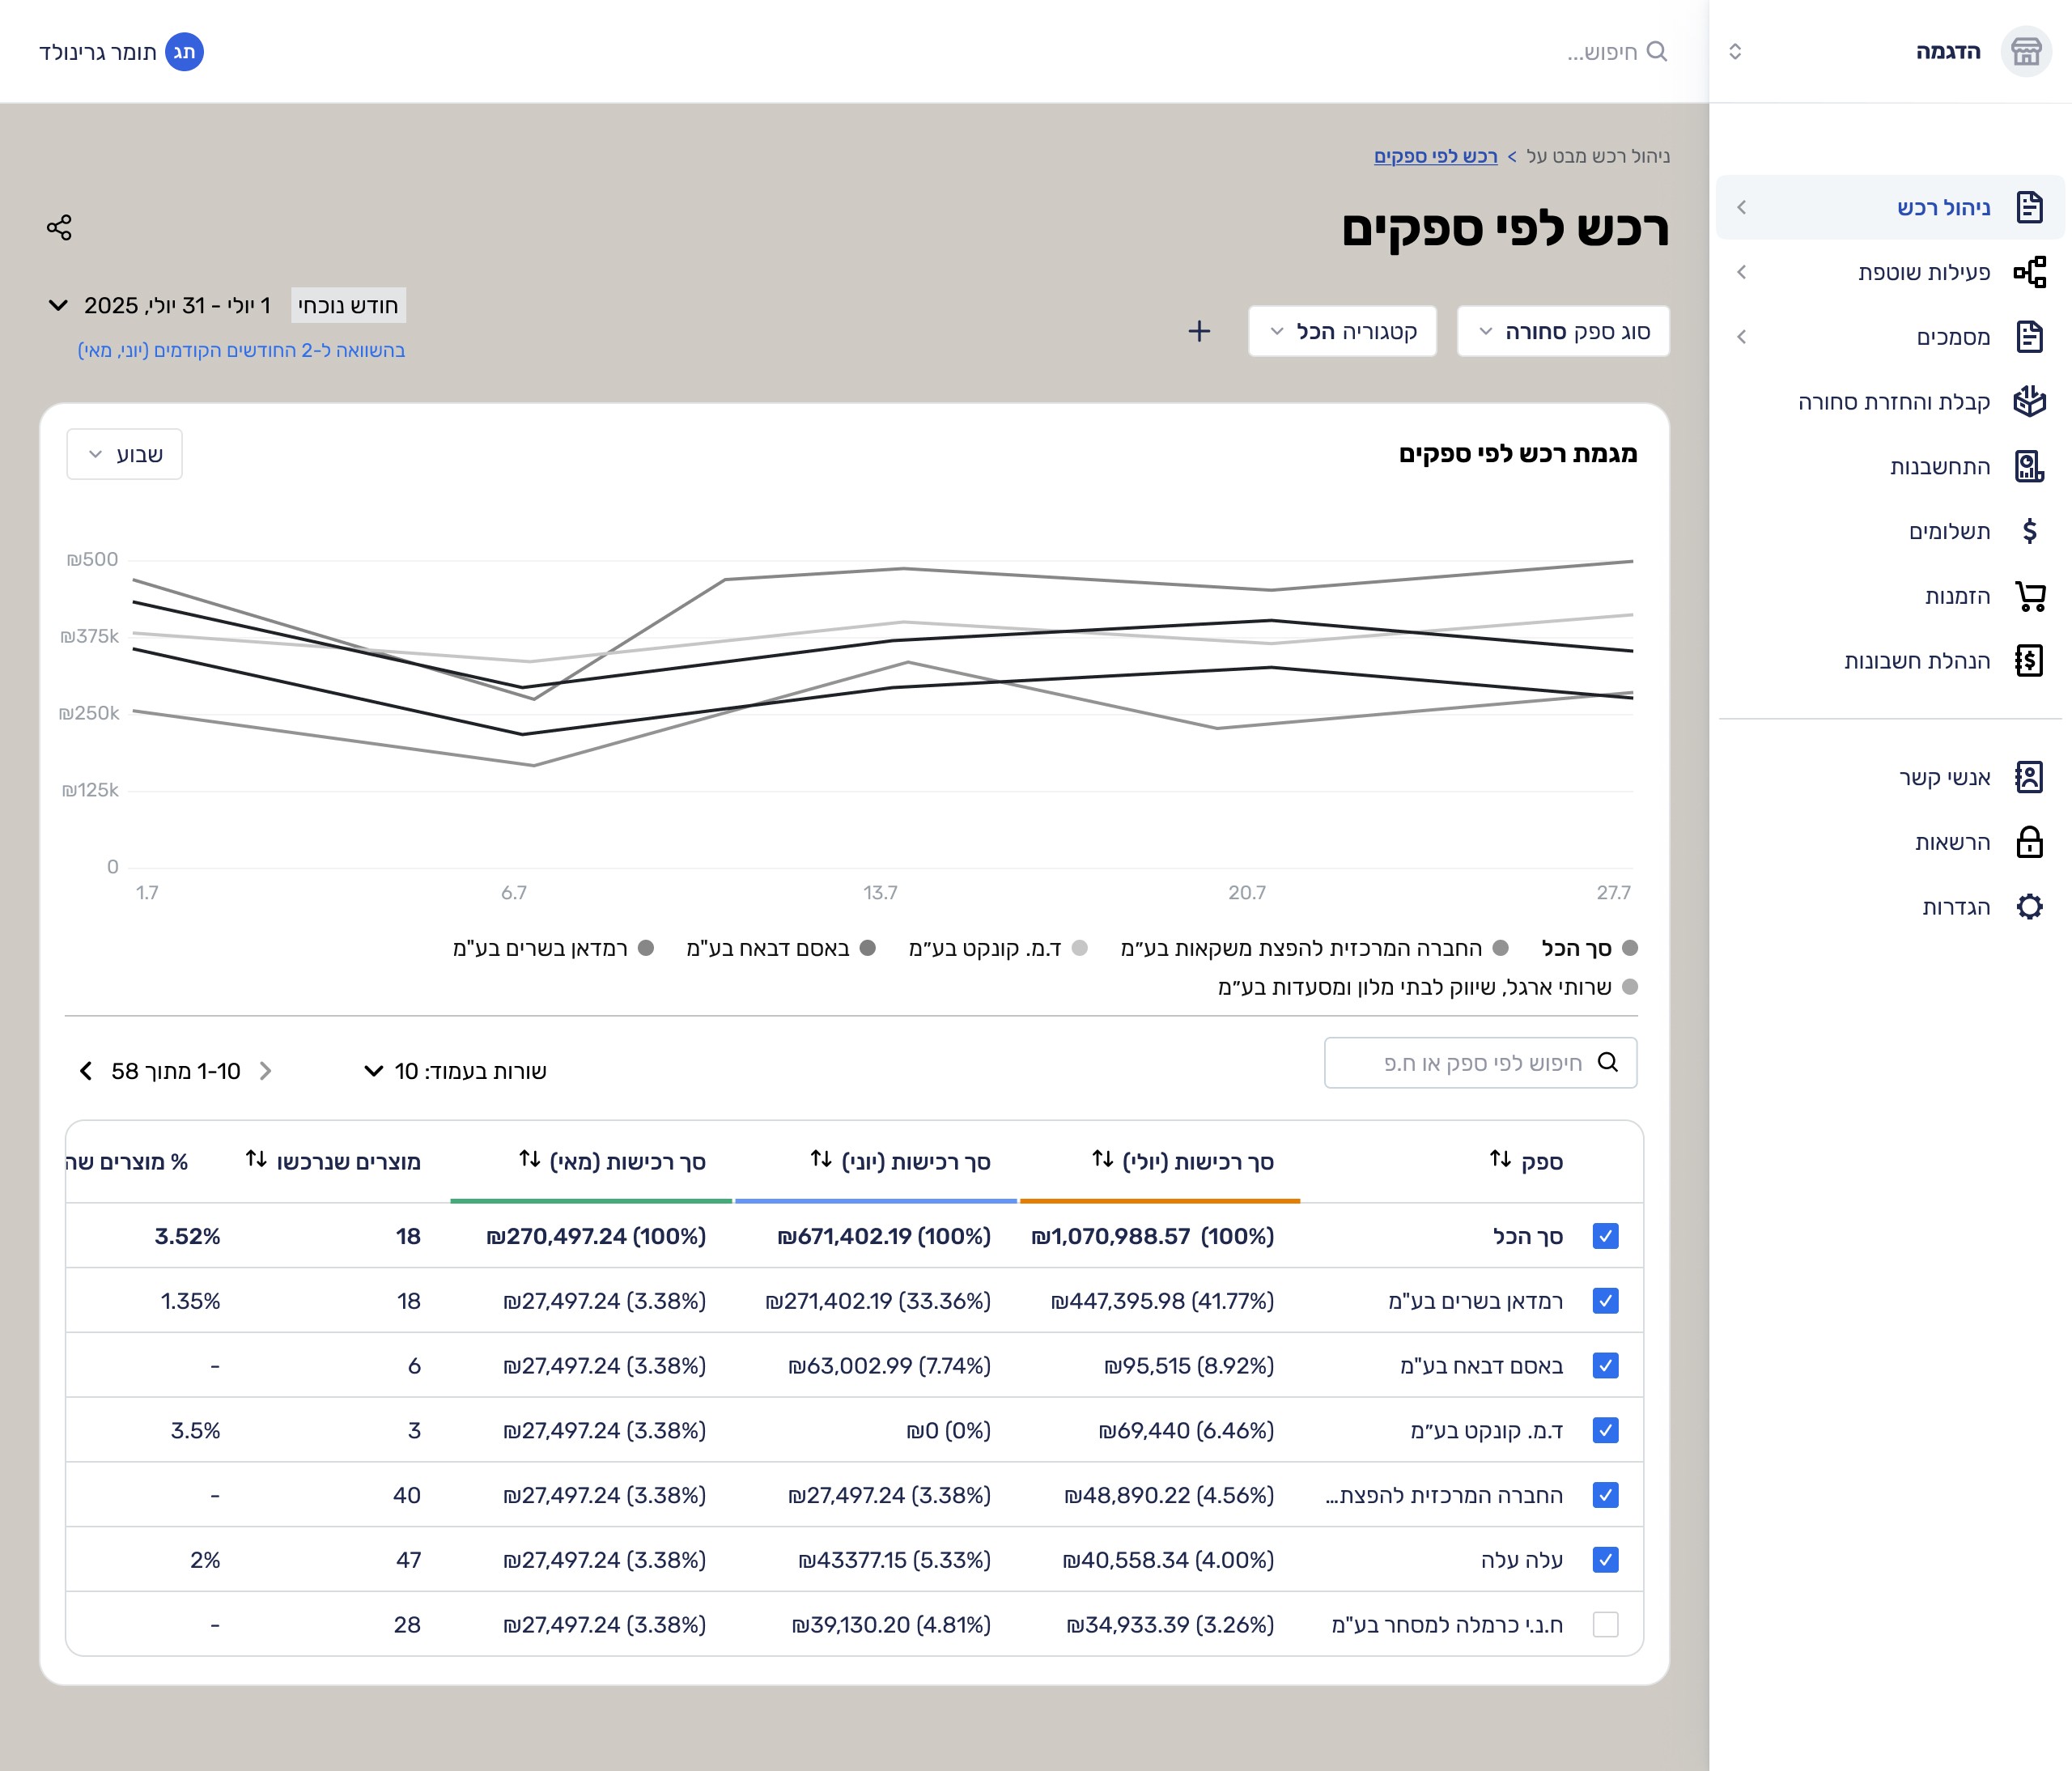
Detailed reports, insights in depth
Desktop version tailored for deep analysis and decision-making, with a mobile version for reviewing key report highlights on the go.
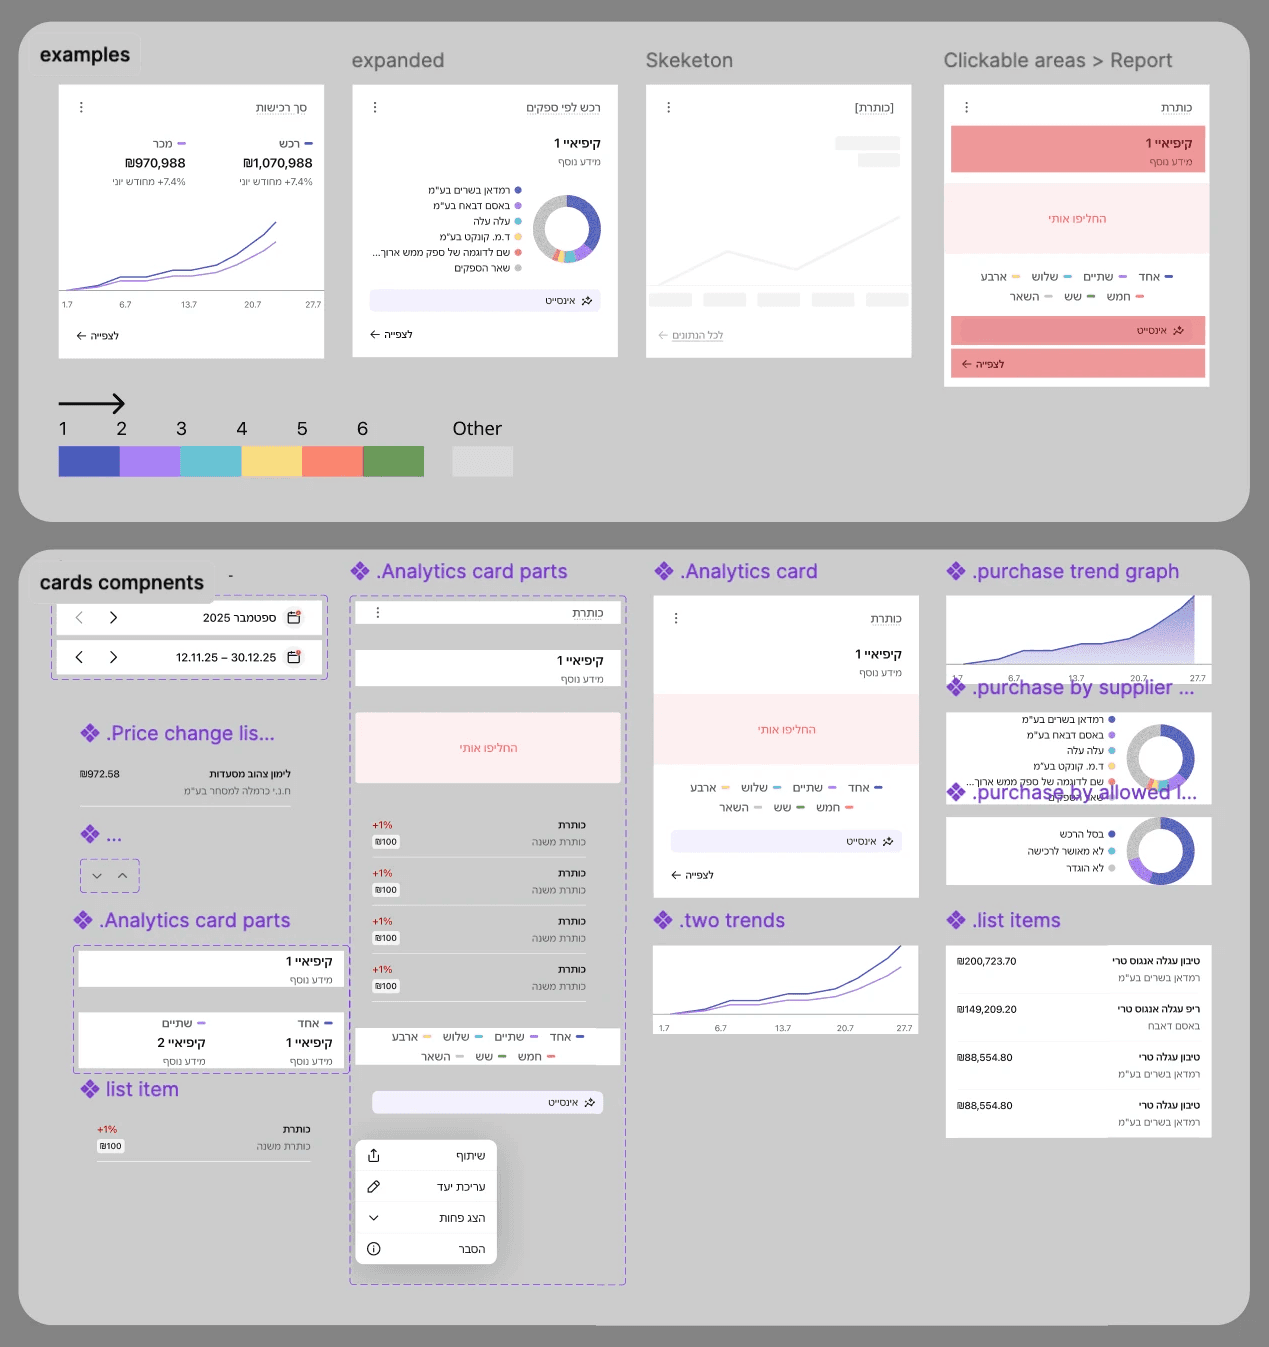
Build for Scale
The widgets are built from a shared set of simple building blocks, so new cards can be created by reusing the same layouts, charts, and lists instead of designing each one again.
Validation
I Used real production data to ground the design in actual behavior.
Built a high‑fidelity prototype to simulate the final experience.
Reviewed the flow with stakeholders and design partners.
Collected qualitative feedback and used it to refine the solution.